
Words by Dr. Lizz Schuyler, ACLC Sr. Director of Science & Conservation, Images by Denise Silfee, ACLC Director of Programs & Communications
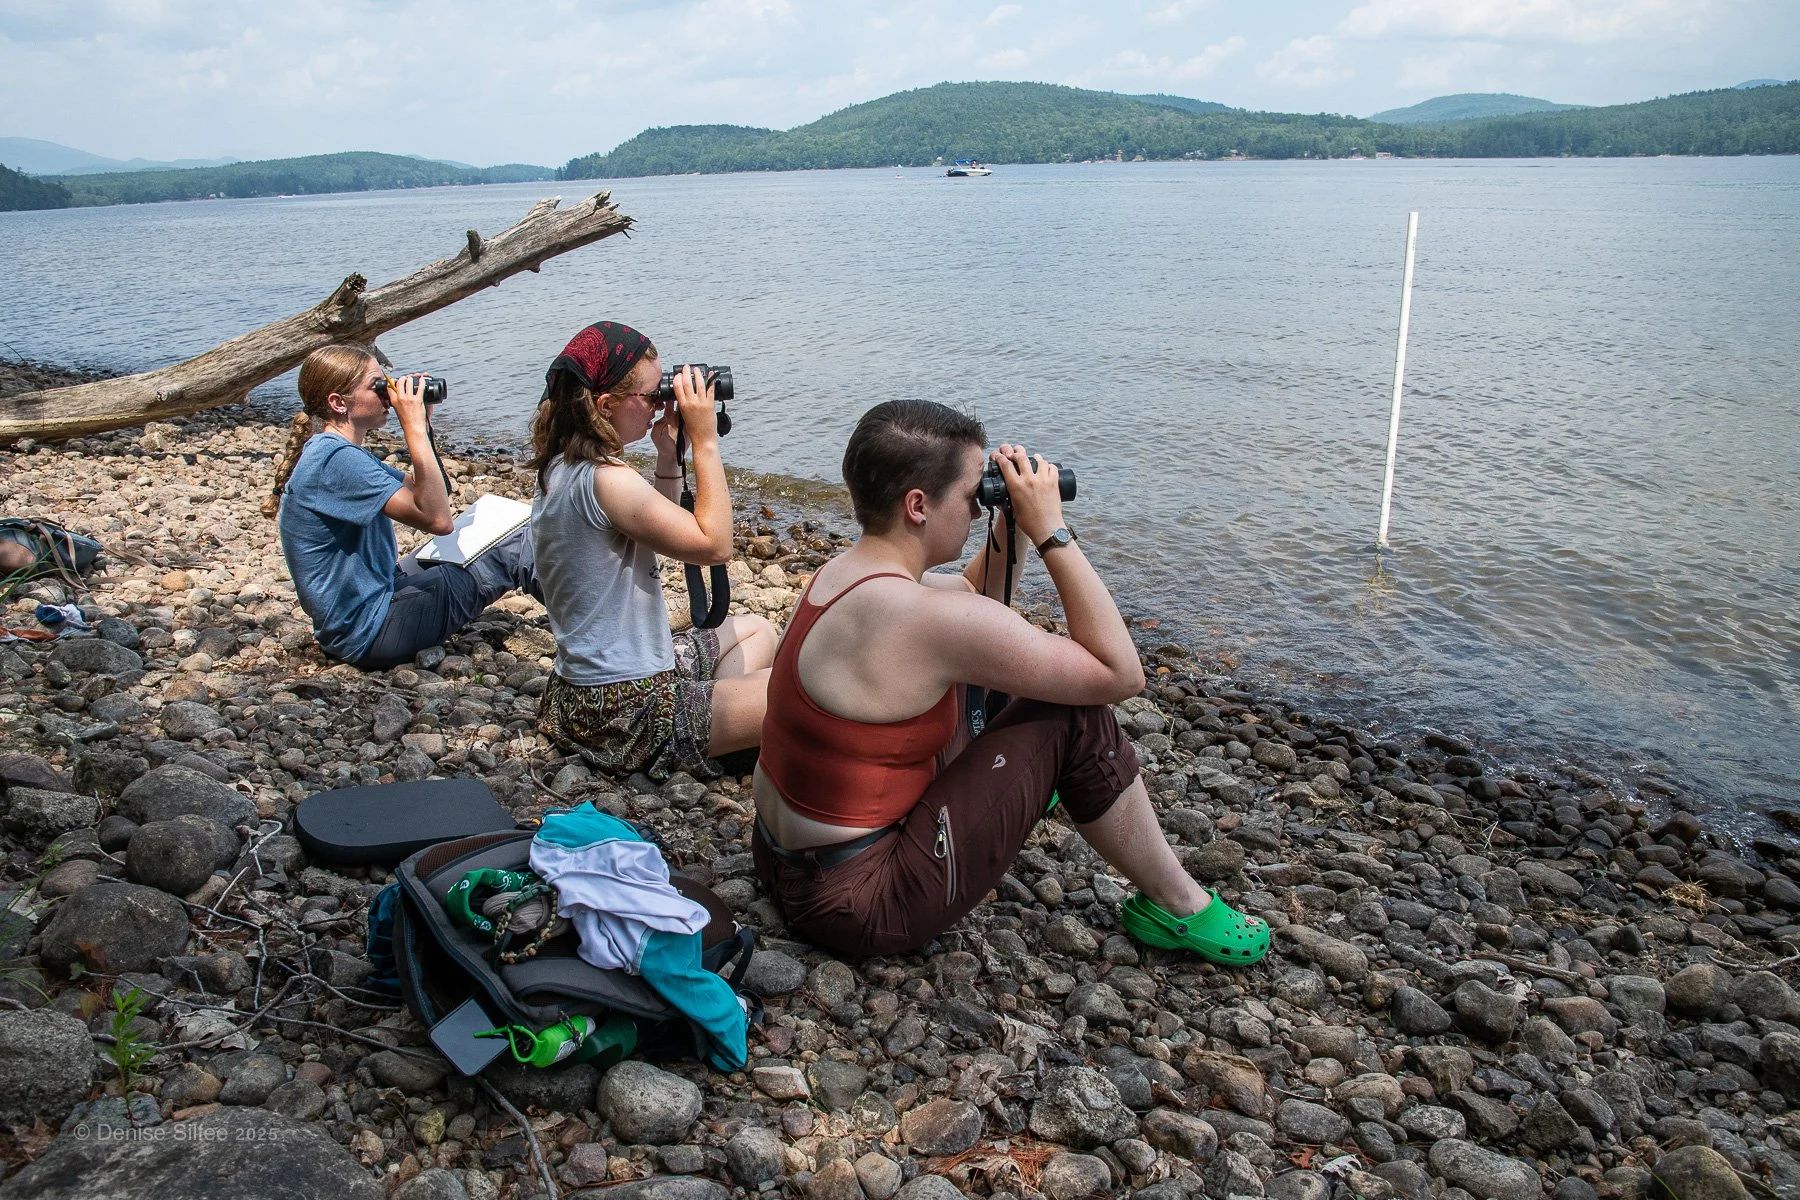
ACLC’s 2025 research interns Emilia Ciesla and Brigitte Walla are joined by outreach intern Jenna Ward to count and categorize boats and measure wave height during a boat observation interval.
First Year Lessons and Results
This summer, the Adirondack Center for Loon Conservation (ACLC) rolled out a new community science project. The Boat Impacts Study called for interested community members to serve as community scientists to collect data about boat use on Adirondack lakes.
This study was designed and piloted in 2025 by research interns Brigitte Walla and Emilia Ciesla, who were given some guiding questions and tasked with creating data collection methods that would would work for volunteer data collectors.
Using common materials that can be obtained inexpensively, participants were trained to collect three types of data:
Count and categorize types of boats (motorized, personal watercraft (jet skis), wake boats, or human-powered/paddle boats) observed in a 15-minute interval
Measure the height of waves produced by boat activity
Collect a water clarity reading using a do-it-yourself Secchi disk
With this data, ACLC hopes to begin forming answers to questions like:
What types of boats are present on Adirondack lakes?
Are certain types of boats producing larger waves that could be damaging to shoreline and loon nests?
Is boat activity contributing to cloudier water at certain times of the day that would make it difficult for visual predators like loons to hunt prey?
From June to August this year, ACLC interns and volunteers watched boats, measured waves and collected water clarity data across seven lakes as part of the pilot year of the study. The results have provided both a useful first look at boat use patterns and important feedback about how to improve the study methods to make community participation more accessible.
Data We Received So Far
All data collected was entered into a Survey123 form that was accessible on a cell phone with or without reception. Participants could enter data for all three areas, or choose to only collect data about one or two areas.
From June 28 to August 28, 2026, participants collected data on Schroon, Lake Placid, Indian, Fourth, Long, Forked and Rich lakes. ACLC received 58 water-clarity readings, 69 boat survey sessions and nearly 209 individual boat observations. Participants recorded boat traffic, weather, wave heights and water clarity measurements.
While the results received this summer point to some possible trends, they don’t allow us draw firm conclusions yet.
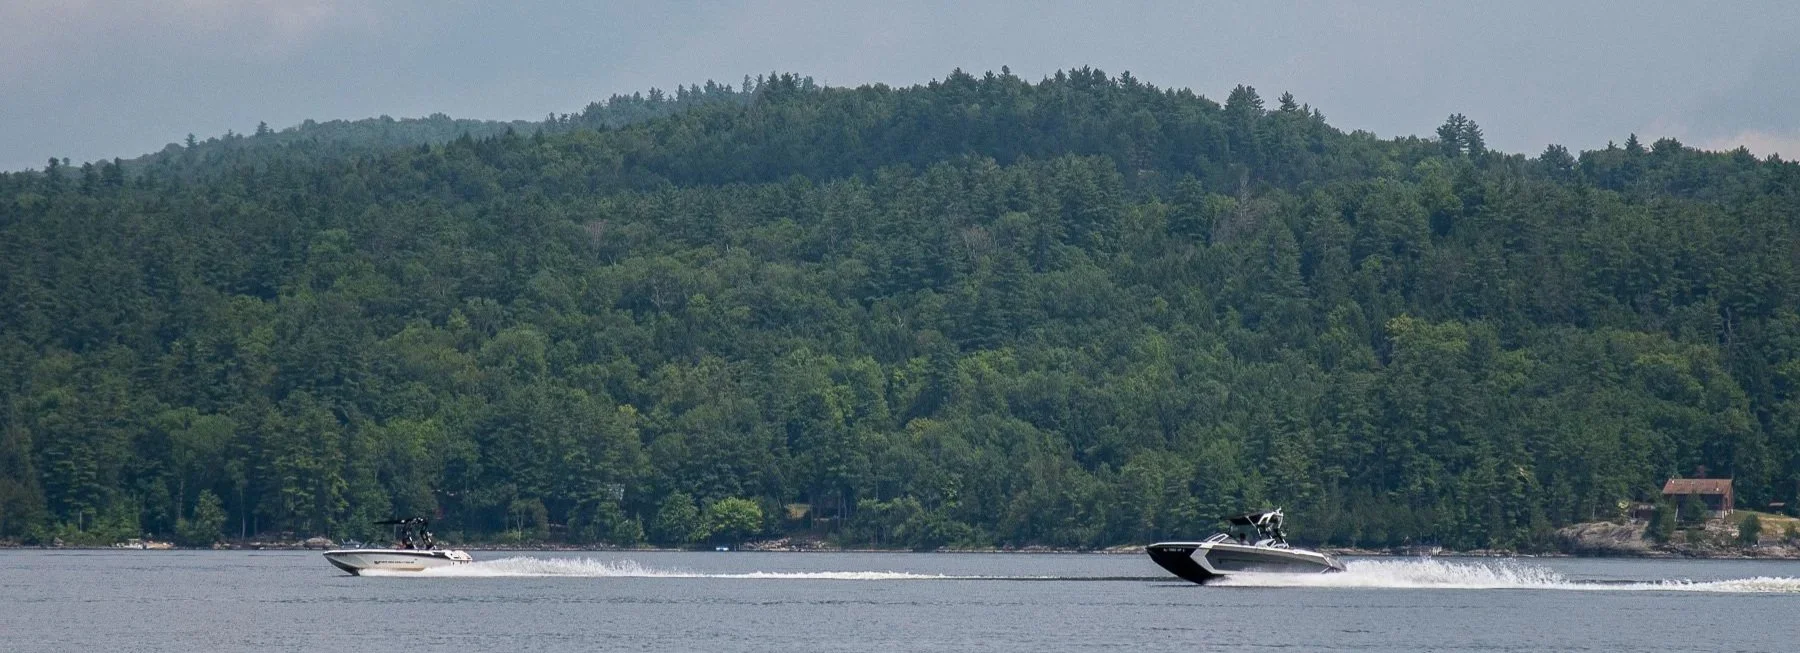
Community science volunteers counted and categorized boats during 15-minute observation intervals.
A Busy Summer on the Water
Motorboats were by far the most common boats observed. During the busiest 15-minute intervals, observers counted between 10 and 21 motorboats. Jet skis were the next most common motorized craft, while wake boats were a much smaller part of the overall traffic: 37 were recorded across all intervals, compared with 371 motorboats.
One important thing we learned: Wake boats, defined as specialized powerboats engineered to displace water to create surfable waves, can be extremely difficult to identify accurately. A major characteristic of wake boats is that they have large ballast tank systems that fill with water to weigh the boat down and help it displace more water. While wake boats are pretty easy to identify when they are in ‘wave-producing mode,’ it can be trickier when they are operating like any other motorized boat. Because ballasts are almost impossible to see from shore, observers used other visual cues to try to correctly identify the boats, but this mean there could be errors in identification that make it hard to know if the presence of wake boats was under or over-represented.
Big Waves Come From Different Types of Boats
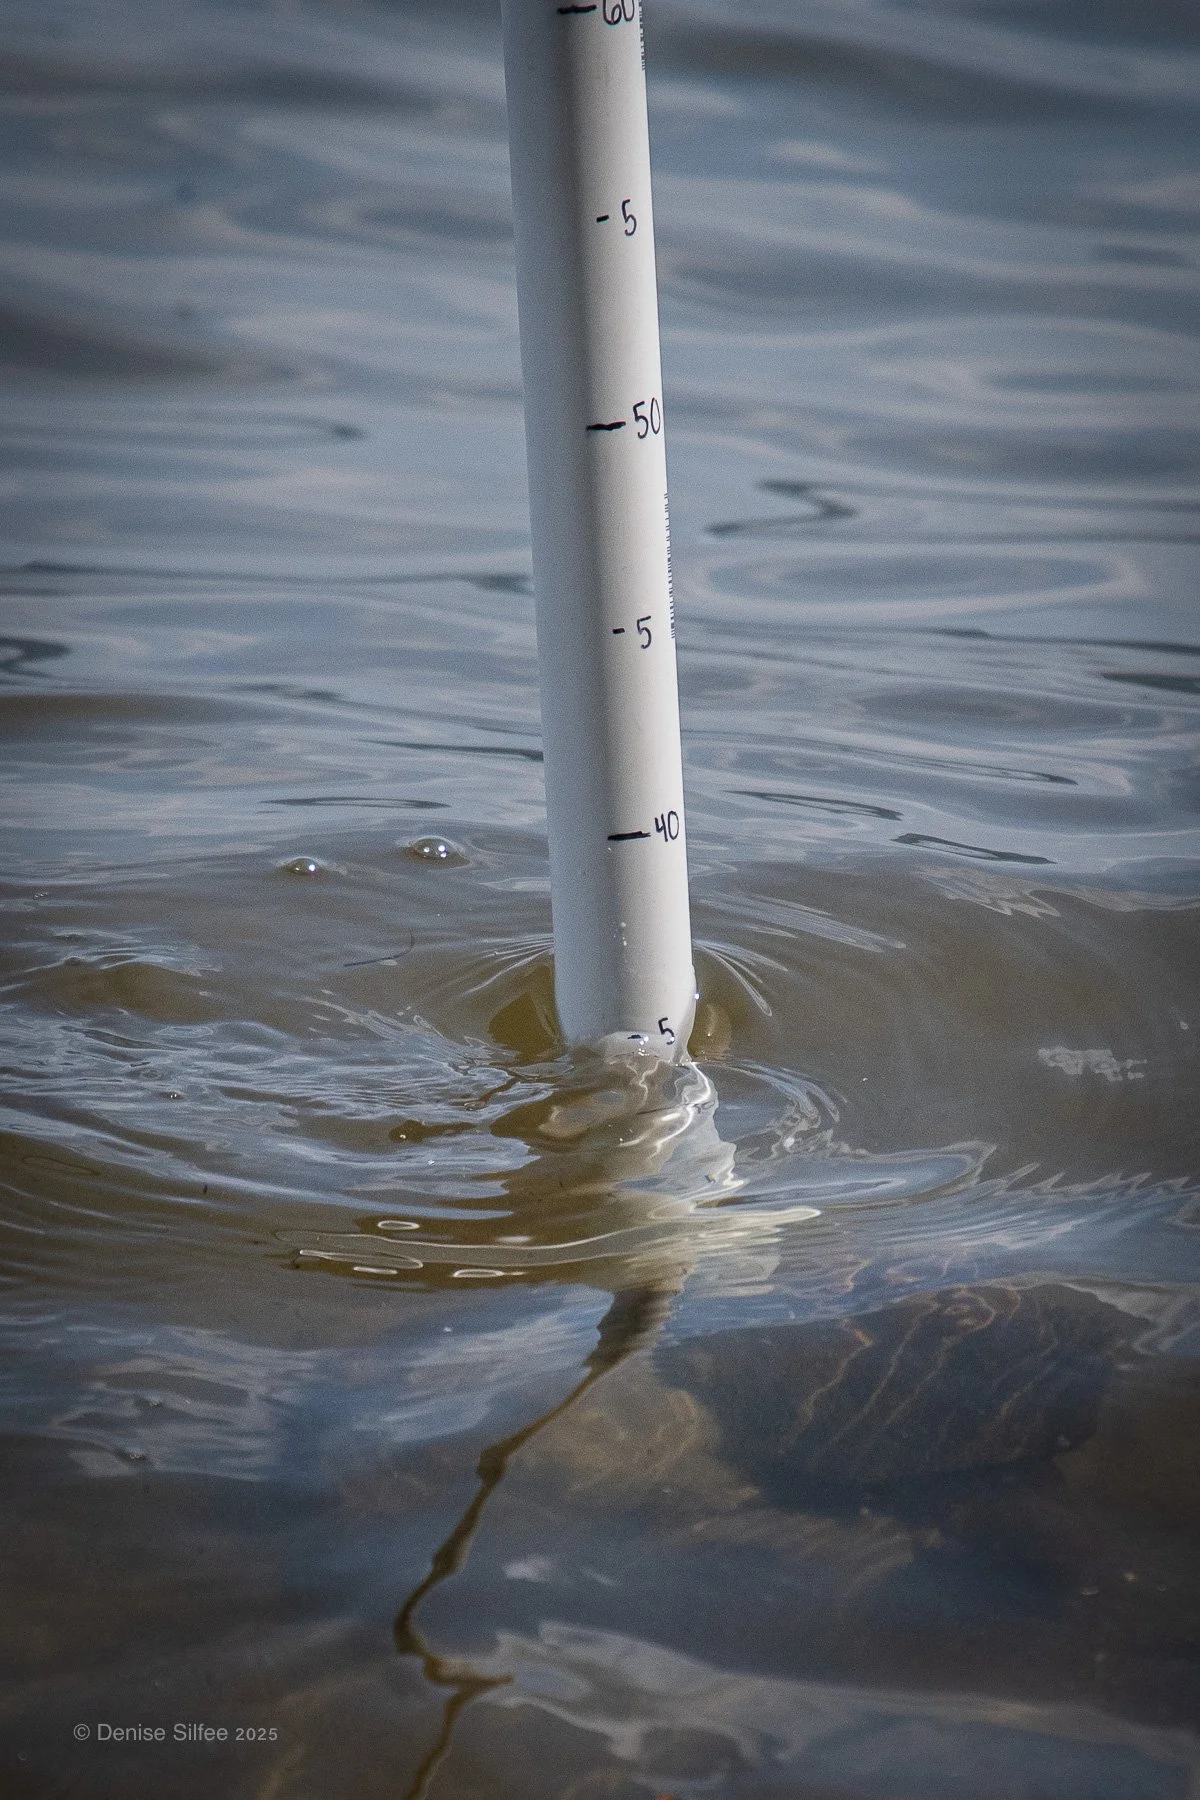
Community science volunteers measured wave height with easy to obtain materials like PVC pipe with measurements in centimeters added by hand.
Most measured maximum waves were between 5 and 15 centimeters. But there were some much larger readings: 36 centimeters on July 4, when pontoons were pulling tubers, and 30 centimeters on June 28 and August 22.
At the level of individual observations, motorboats and wake boats made the largest waves. Jet skis generally made smaller waves (1 to 6 cm) and kayaks and similar craft made none. Towing tubers and carrying a heavy load also appeared to produce substantial waves, demonstrating that distance from shore (which is not something participants were able to measure) matters when it comes to preventing the types of waves that can damage shoreline and wildlife habitat.
What Can We Say About Wake Boats?
Intervals with wake boats had an average maximum wave height of 11.7 centimeters. Intervals without wake boats averaged 9.9 centimeters. That difference (~1.8 centimeters) is in the direction we might expect if wake boats contribute to larger waves. But the comparison is based on just 21 intervals with wake boats, and the difference could reflect other factors, including wind, lake conditions or the mix of boats present.
The largest waves recorded came from towing tubers and heavily loaded boats, not from observations identified as wake boats. So, for now, the data suggest wake boats may add to wave height, but they don’t prove it. It is also important to note that our readings were from shore, and the maximum wave height from wake boats is generally 3-5ft from the stern.
Water Clarity
Water clarity differed across the lakes. Lake Placid had the clearest average readings, at about 5.6 meters, while Long Lake had the lowest, at about 2.2 meters. Schroon, Forked and Rich lakes became clearer over the course of the summer.
Those differences don’t tell us that boating caused the water to be clearer or murkier. Lakes naturally vary in depth, bottom material, runoff and other characteristics. And because the clarity readings were taken once per visit—not necessarily immediately before and after busy boating periods—they can’t show whether a boat’s wake briefly stirred up sediment.
Depth is important, too. Wake boats may stir the lake bottom in shallow water, but this summer we did not record the depth at the locations where boats were operating. We therefore can’t test that possibility with these data. Next year we will measure water clarity at the threshold of the recommended water depth of 30 feet. Current wake boat studies from other states have measured disturbance to lake beds at 20 feet, but there is no data to show at what depth disturbance does not take place.
Why Wave Height is Only Part of the Story
There isn’t one wave height that causes shoreline erosion everywhere. The outcome depends on the bank’s material and slope, vegetation, water depth and how often waves arrive. A sandy, unprotected bank may be more vulnerable than a rocky or well-vegetated shore.
As a rough guide, waves under about 10 centimeters are often minor, while repeated waves around 10 to 20 centimeters can stir sediment and gradually affect vulnerable banks. Waves above 30 centimeters may be damaging on many natural shorelines. But the frequency, location (distance to shore and water depth) of waves matter as much as a single reading.
The average maximum wave in our measured intervals was around 10 centimeters—near the lower end of the range where impacts may begin on vulnerable shores. The highest readings, up to 36 centimeters, were much larger. Knowing where those waves occurred and how often similar events happen will be essential to understanding their shoreline effects.
Distance from shore is another key piece of the picture. Many distance readings were exactly 400 meters, likely because that was the range finder’s limit. That makes it difficult to know how close boats were to shore, and how that distance influenced wave height.
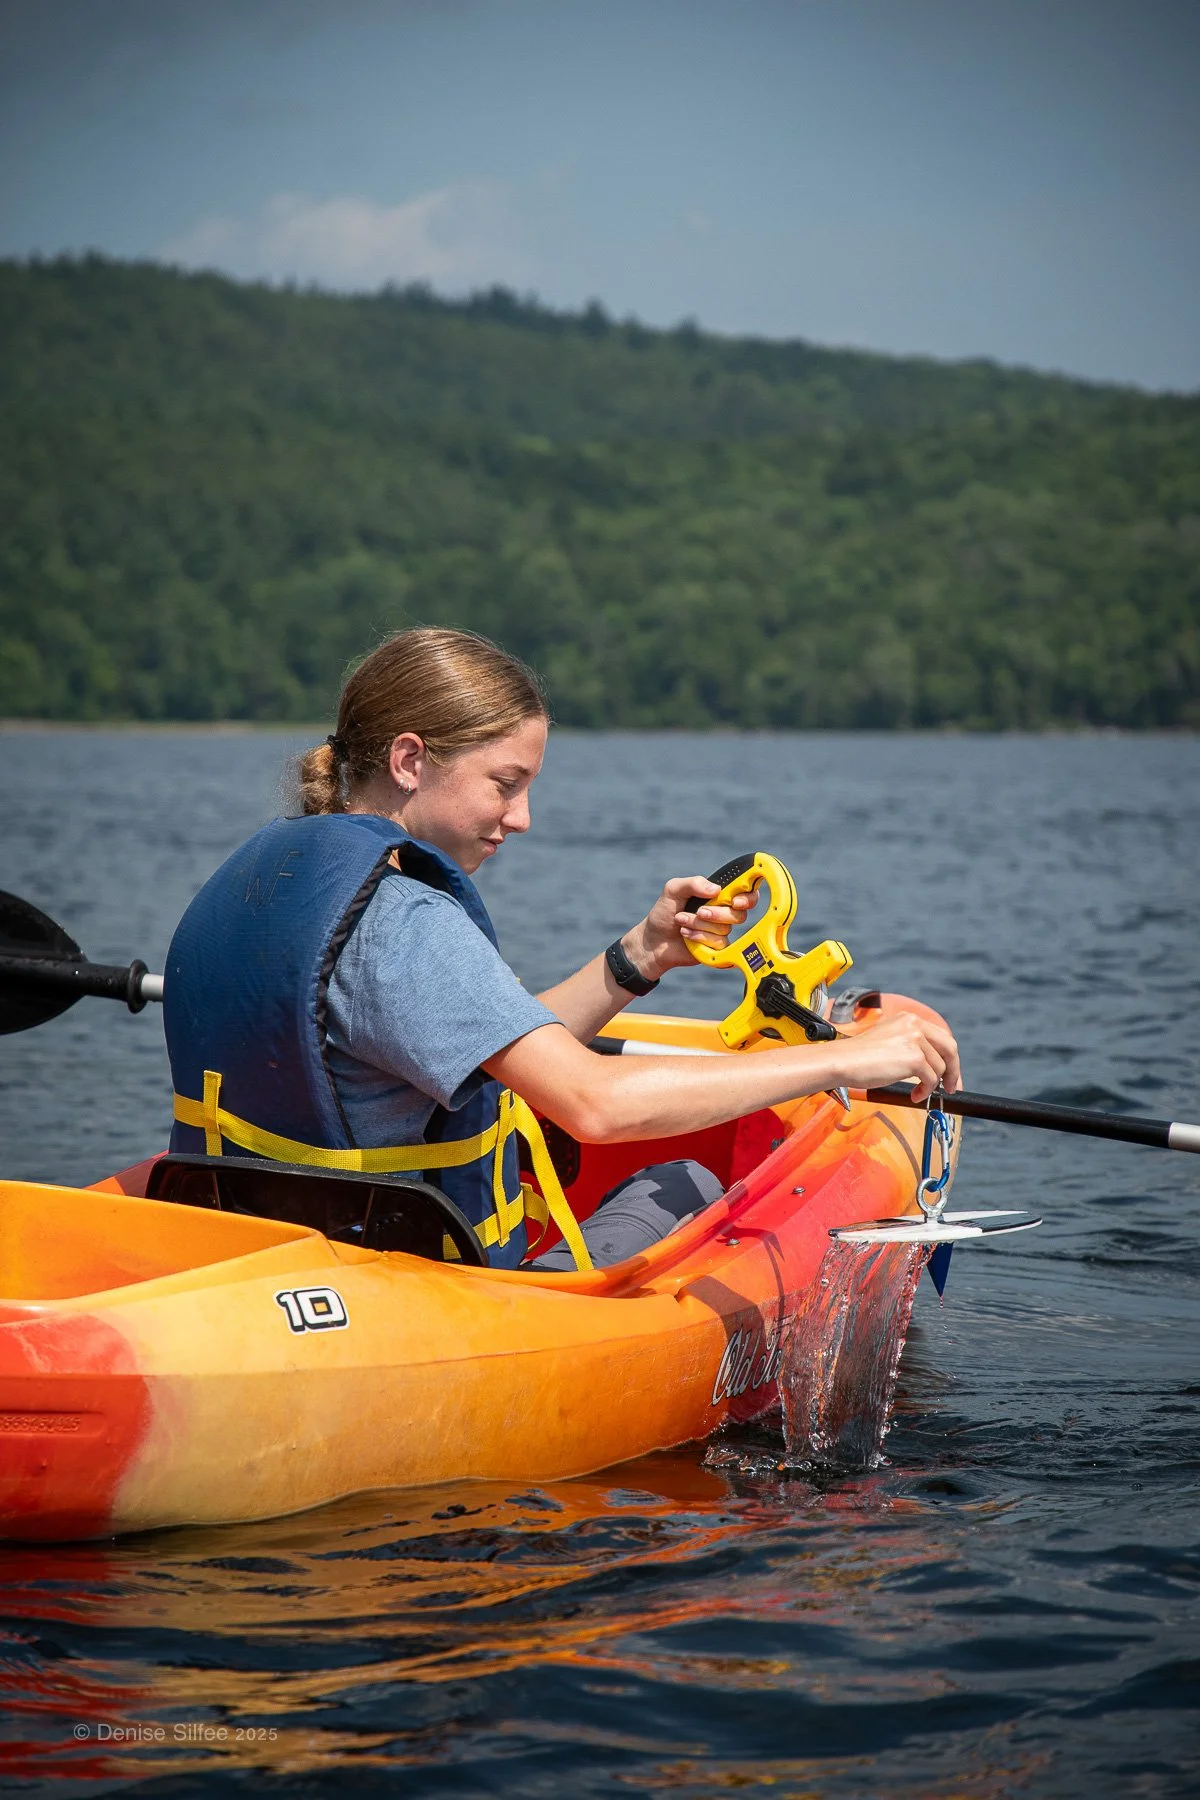
The water clarity portion of the data collection proved to be the trickiest for participants to complete. ACLC plans to make changes to the data collection protocols for 2027.
What We Learned
This year’s rollout was a successful first attempt but showed a need for some changes before the next round of monitoring in summer 2027. One standout piece of feedback was that asking community participants to do all three types of data collection was a challenge. Specifically, we think the water clarity portion may have been burdensome for requiring participants to purchase and make their own Secchi disks and may have made the time commitment too inconvenient.
To improve this data collection protocol for next summer, and to improve the quality of the data collected, our research team is planning to assign this portion of the study to our summer research interns. Over a roughly three-week period leading up to and then ramping down from a busy boating holiday, the interns will be asked to take a clarity reading in the morning and afternoon on lakes with high boat traffic and comparing the results to lakes with no motorized boats. This will hopefully provide information about how, if at all, increased boating activity affects water clarity at different times of the day and during busy holiday weekends. It will also help us tease out some of the environmental variables and make the community participation part of the study smoother.
Next year, community participants will be asked to conduct boat counts and wave height measurements only, which can be done in an easy 15-minute time period, up to three times in a day. We hope this makes participation more smooth.
Adirondack Wake Boat Coalition
ACLC is one of six environmental organizations that have come together to form a Wake Boat Coalition, a working group collaborating to review wake boat research, help communities find answers to their questions about wake boats and their potential impacts on waterbody health, coordinate Adirondack-based studies, and develop pathways for communities who want guidance on managing wake boat use on their lakes.
The other organizations are Adirondack Council, Adirondack Lakes Alliance, Adirondack Watershed Institute, Protect the Adirondacks and Upper Saranac Foundation. The coalition is planning a webinar highlighting resources for managing wake boat use at the local level. The webinar will take place in early January and details will shared on social media when they have been confirmed.
The Boat Impacts Study is a first step at gathering information about boat use in the Adirondacks. If you would like to be added to a contact list about this effort, you can complete this form to make sure you get all communications first and directly in your inbox.
We would like to thank the community science volunteers who participated in the study this summer and we encourage everyone to participate again next year!
